One of the main challenges for active amateur radio operators is keeping track of QSO statistics—whether for total QSOs, modes, or year-to-date counts—especially when managing multiple stations. That’s why I created import_wavelog_qsos_to_io.Broker, a JavaScript script that runs in ioBroker and automatically retrieves, aggregates, and writes QSO statistics from Wavelog via their API. The best part? It enables real-time visualization across your dashboards or on fun devices like Awtrix-based pixel clocks.
The Project at a Glance
You can find the complete repository on GitHub: import_wavelog_qsos_to_io.Broker by Daniel Beckemeier (DL8YDP) (See the repository and code on GitHub).
Features & What You’ll Find in the Repo
- Multiple Implementation Scripts
getwavelogdatatoiobroker_new_api_summed_up_stations.js– the recommended version: fetches stats from multiple station IDs and sums them up across all QSOs.getwavelogdatatoiobroker_new_wp_api.js– an earlier version that relies on a single station ID.getwavelogdatatoiobroker_old.js– deprecated and inefficient; avoid using it.
- Compatibility
- Requires Wavelog version 2.0.1 or newer, since it uses their official API endpoint.
- Objects to Configure in ioBroker
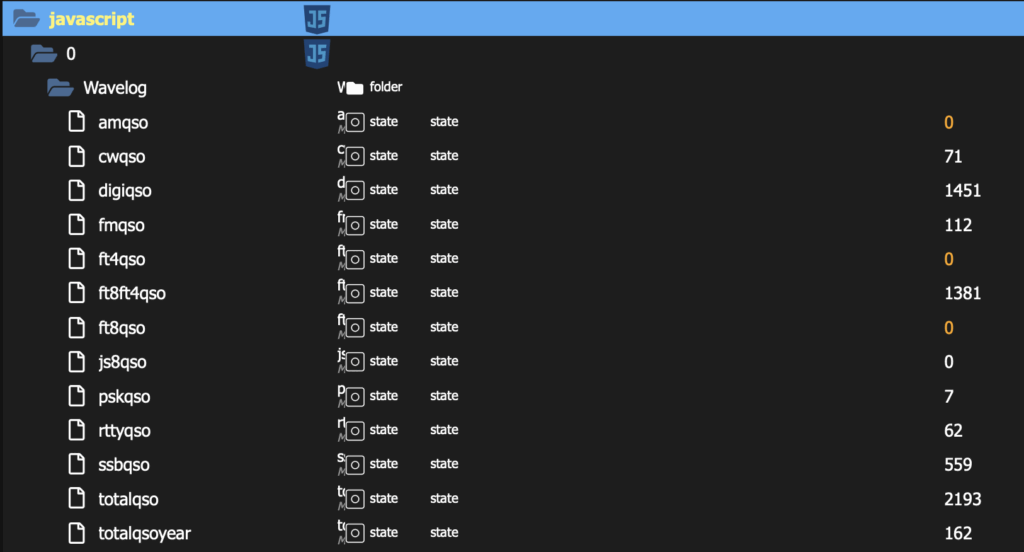
Create these under your JavaScript adapter in ioBroker: javascript.0.Wavelog.totalqsojavascript.0.Wavelog.totalqsoyearjavascript.0.Wavelog.ssbqsojavascript.0.Wavelog.fmqsojavascript.0.Wavelog.rttyqsojavascript.0.Wavelog.ft8ft4qsojavascript.0.Wavelog.ft8qsojavascript.0.Wavelog.ft4qsojavascript.0.Wavelog.pskqsojavascript.0.Wavelog.digiqsojavascript.0.Wavelog.cwqsojavascript.0.Wavelog.js8qsojavascript.0.Wavelog.amqso
These data points are automatically updated every 10 minutes.
Why Use This Script?
- Automated Data Aggregation – No need to manually poll stats per station.
- Multi-Station Support – Ideal if you log QSOs across multiple remote or mobile setups.
- Seamless Visualization – Useful for dashboards, or even animated pixel displays (via Awtrix or similar).
- Open Source & Licensed (GPL‑3.0) – Feel free to use, modify, or expand—but remember to comply with the GPL.
Installation in 2 Minutes
- Navigate to your ioBroker instance.
- Create the objects listed above inside your JavaScript adapter.
- Copy the preferred script (
..._summed_up_stations.js) into a new JS file in ioBroker. - Insert your Wavelog API URL, API key, and station IDs.
- Save, and let it run every 10 minutes—your stats magically populate in ioBroker!
Bonus: Awtrix Pixel Clock Display
If you’re into visual gadgets, see how statistics can be sent to an Awtrix-powered pixel clock (Ulanzi TC001) for a sleek, real-time display of your QSOs. Bonus: there’s even a ZIP with 16×16 pixel icons to embellish your clockface.